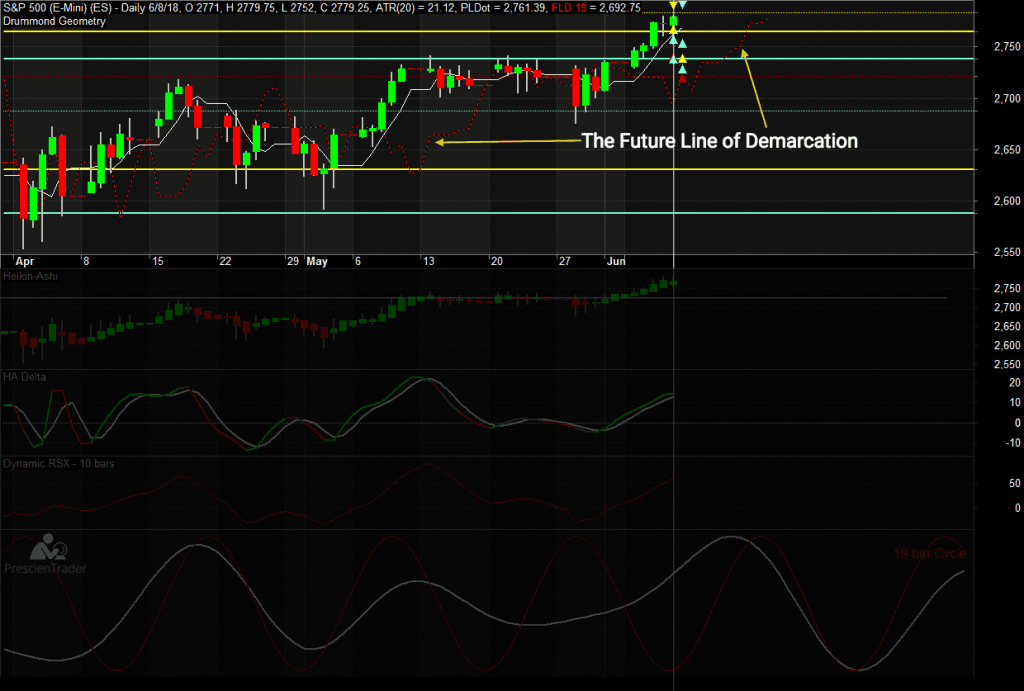
The famous cycles researcher, JM Hurst, invented the Future Line of Demarcation (FLD). To draw the FLD, you simply shift the price graph forward by half a cycle length. This is both deceptively simple and incredibly powerful. If the cycle length is accurate, when price crosses the FLD, it confirms the most recent peak or trough for the corresponding cycle frequency.
Conventional cycles analysis relies heavily on Price/FLD interactions to forecast price. Hurst developed an elaborate methodology describing how to interpret various FLD patterns and price interactions. While there’s much validity to Hurst’s research, he developed his theories before the invention of modern computers. Therefore, doing a conventional cycles analysis following Hurst’s methodology involved many steps and manual calculations. More recently, software applications have been developed that automate and streamline much of the process. While these applications make it easier to perform a cycles analysis, they’re still limited by a theoretical framework developed more than 40 years ago. Rather than advancing the science, these applications simply automate old analysis techniques.
When we developed PrescienTrader, we started with a clean slate. We recognized Hurst’s contributions to the science of cycles analysis, but we didn’t want to limit ourselves to a 40+ year old methodology. Instead, we tested Hurst’s theories objectively and when they held up, we incorporated them into our algorithms. We also experimented with more modern algorithms, such as those developed by Lars von Thienen of WhenToTrade.com. We found that Lars’s algorithms were superior to Hurst’s in terms of extracting individual cycles out of the market noise. However, Lars did not address the issue of peak/trough confirmation, which we felt was important, so we took a closer look at Hurst’s FLD theories. Ultimately, we advanced our algorithms to the point where they included all the information that could be obtained from analyzing FLD/price interactions, so complex FLD analysis became redundant for the purpose of price forecasting. Nevertheless, we still believed a fast FLD could be used as an entry trigger, helping to filter our false signals. Our testing confirmed this.
On our charts, the Future Line of Demarcation appears in the top pane as a dashed red line, mirroring price, but shifted forward by half a cycle length. The displayed FLD dynamically adapts to the fastest active cycle frequency. When the Prescient Line changes direction, we wait for price to cross the FLD prior to issuing an entry signal. Using the fastest cycle frequency as the entry trigger allows us to capture most of the move, yet still filters out many false signals.
Another use for the Future Line of Demarcation is to estimate the price target by observing the change in price between the start of a cycle and the point where it crosses the FLD. Since the FLD is simply price shifted forward by half a cycle length, it’s fair to assume that when prices crosses the FLD, it’s covered half its total distance for the half-cycle. For example, if price is 100 when a cycle begins and it crosses the FLD at a price of 105, you can estimate a price target of 110 for the half-cycle. This often works pretty well, but it doesn’t consider the effects of support and resistance zones. In the above example, if there’s a major resistance area at 105, price may get stuck there, even though it’s technically only at the halfway point of the half-cycle. Thus, when setting price targets, you should also consider other approaches, such as Drummond Geometry.

