See Into the Future
PrescienTrader is the World's Most Advanced Financial Market Cycles Analytic Platform
Instantly analyze any financial instrument in multiple timeframes
Predict future price movements with uncanny prescience
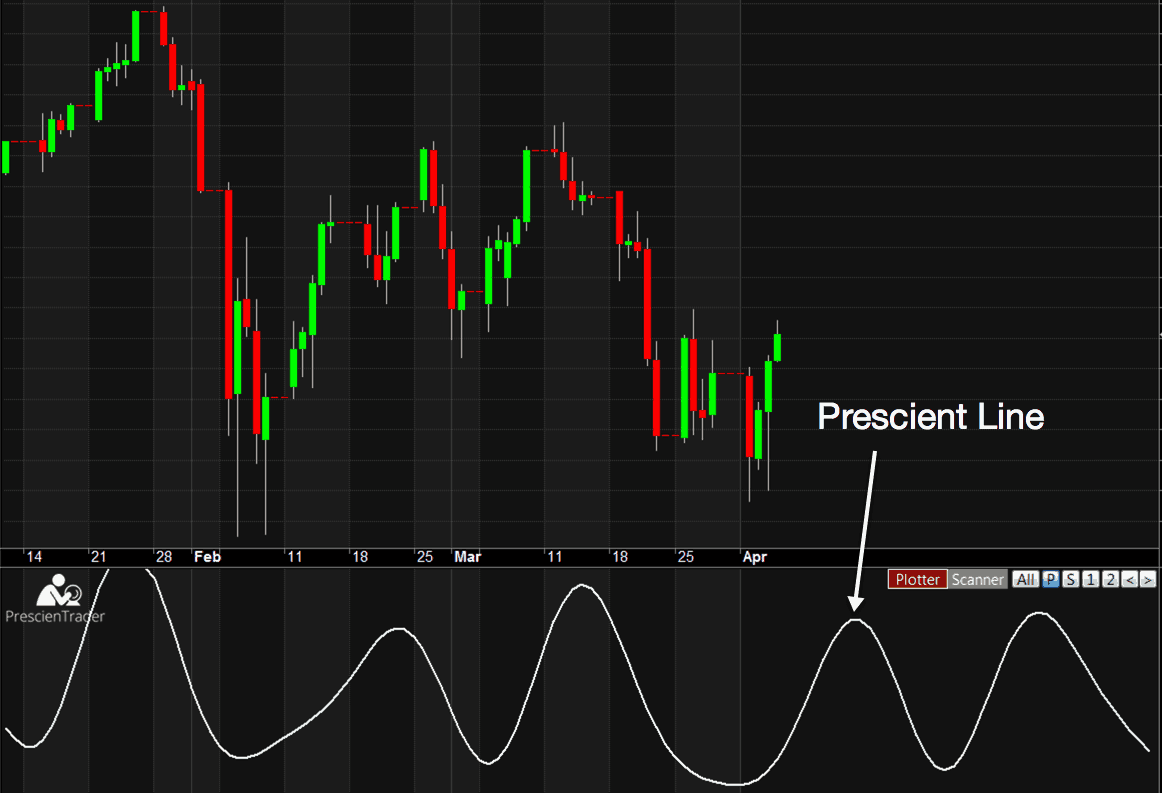
The Prescient Line
PrescienTrader analyzes hundreds of thousands of data points to calculate the amplitude and phase for hundreds of cycle frequencies. Next, our IntelliCycle™ AI technology filters out the market noise and intelligently extracts the optimal frequencies for the market condition. Finally, PrescienTrader combines these cycles and projects them 30-bars into the future, creating the Prescient Line™.
While nothing works 100% of the time, the Prescient Line is amazingly prescient! It's a dynamic, adaptive, leading indicator that updates with each new bar, depending on the evolving cyclical structure of the market. You can think of it like Waze for financial markets, a roadmap that dynamically adapts to changing markets.
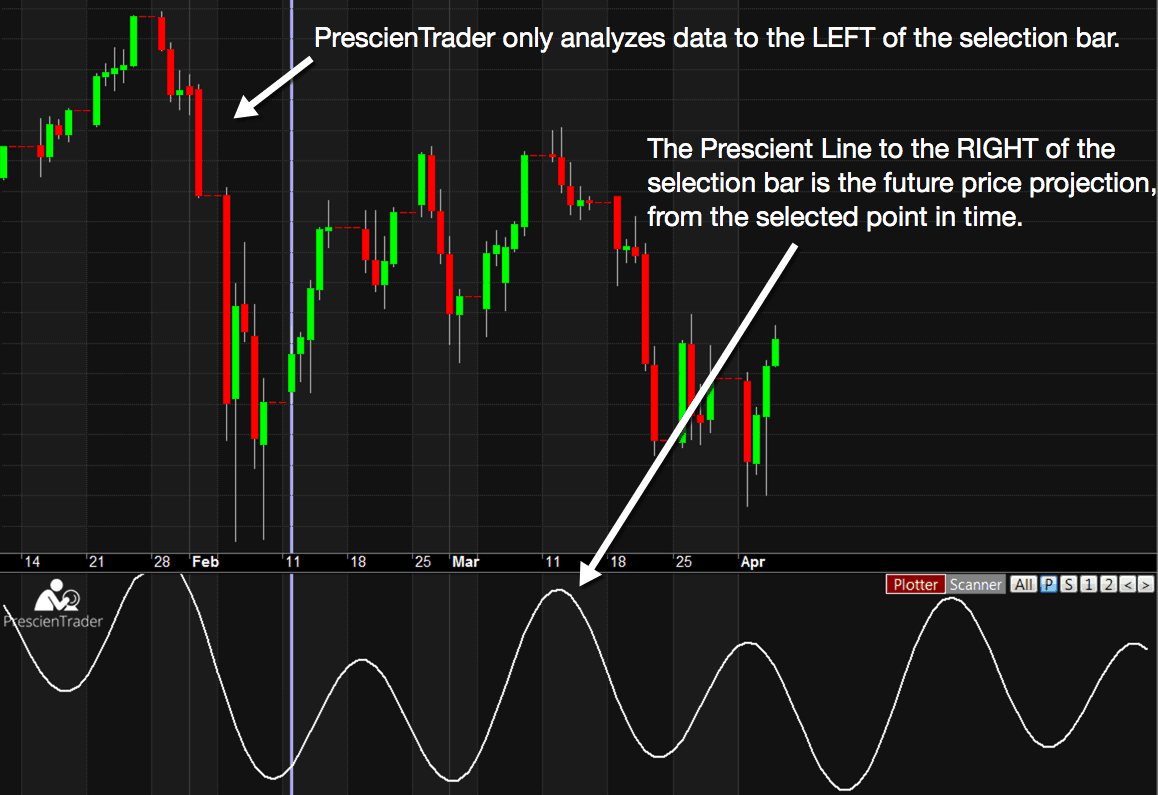
Point-in-Time Analysis
Position the vertical selector line on any bar to perform a Point-in-Time Analysis, which is a cycles analysis at the selected point in time. When performing a Point-in-Time analysis, PrescienTrader only considers data to the left of the selected bar, ignoring price data to the right of the bar. This allows you to visually compare the Prescient Line, starting at that point in time, with actual future prices.
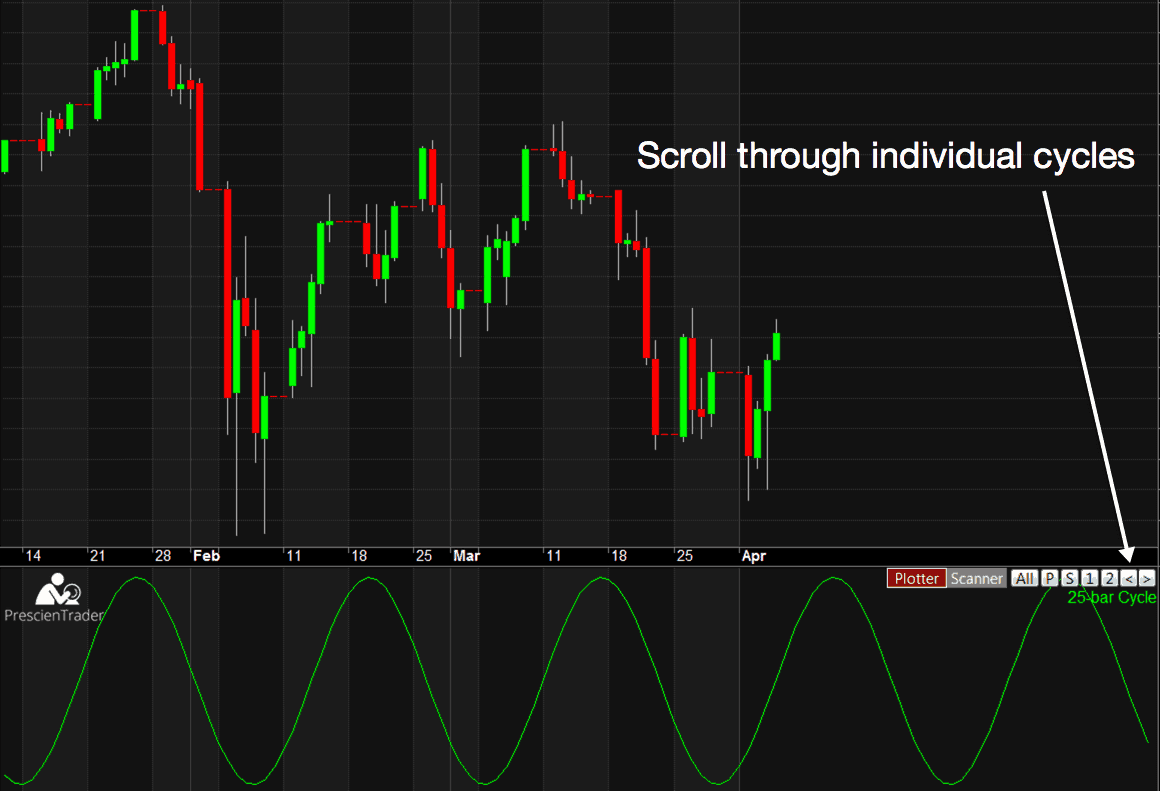
View Individual Cycles
PrescienTrader analyzes hundreds of cycles and extracts only the ones most relevant to current market conditions. While the Prescient Line is the most reliable price predictor, you can also display the individual cycles that form the basis of the Prescient Line. This provides a more granular view of the cyclical structure, which can be useful when making difficult trading decisions.
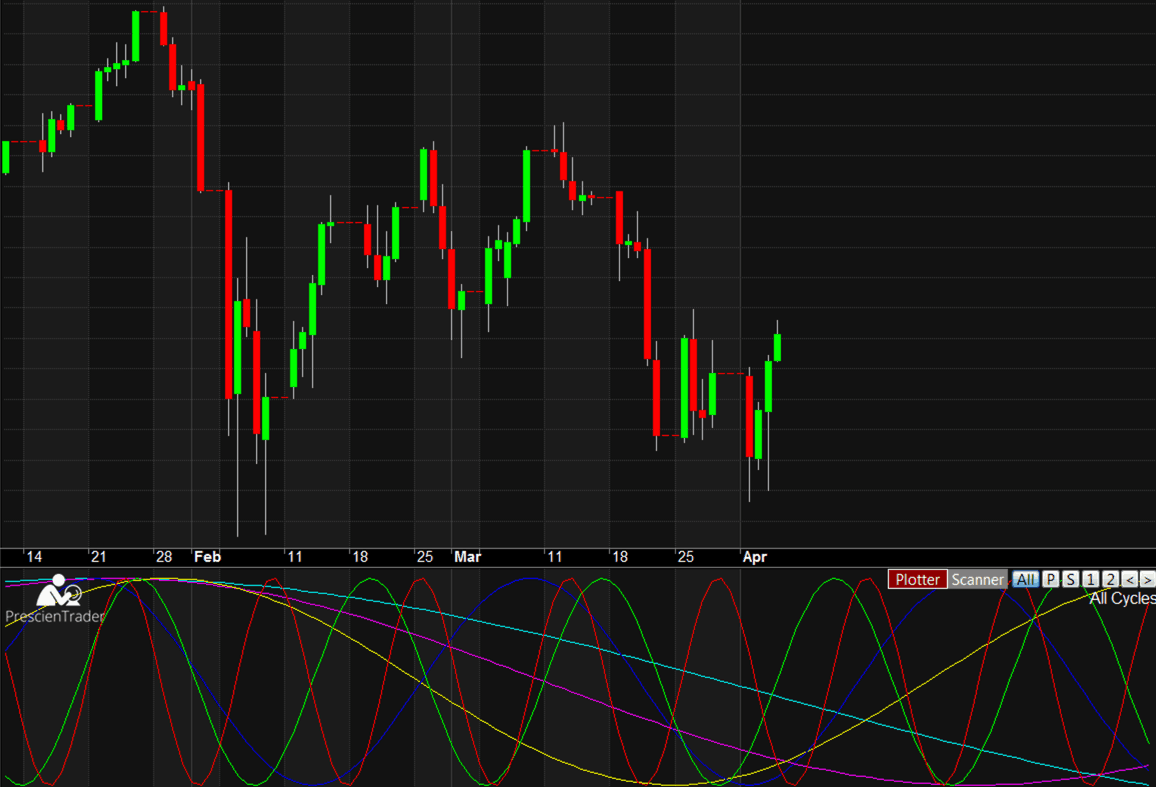
View All Cycles
Besides viewing individual cycles, you can also view all cycles at once. This is helpful for getting a sense of the big picture, in terms of how the cycles are interacting and their effect on price.
Static Prescient Line
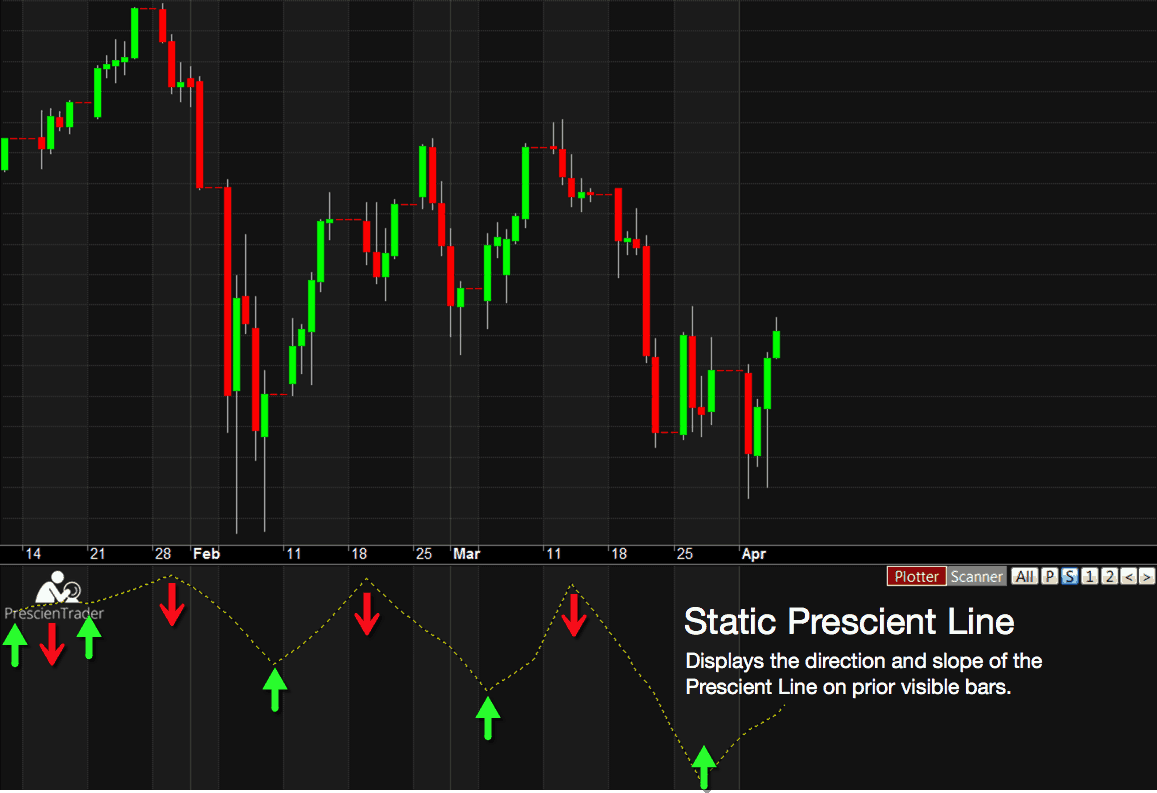
The Prescient Line is dynamic, meaning its shape can potentially change with each new bar. This is essential for trading, as it provides the most accurate and up-to-date analysis for making trading decisions. However, its dynamic nature makes it difficult to look back in time, to see how well it performed on prior bars. Of course, you can perform a Point-in-Time analysis on any prior bar, but that only shows the result for the selected bar. Therefore, PrescienTrader also provides a feature called the Static Prescient Line.
Unlike the regular Prescient Line which changes after each new bar, the Static Prescient Line never changes. When you enable this option, it scans back through all the visible bars and plots the direction and slope of the Prescient Line for each bar at that point in time. Thus, you can easily view all the prior buy/sell signals on any chart.
Multiple Timeframes
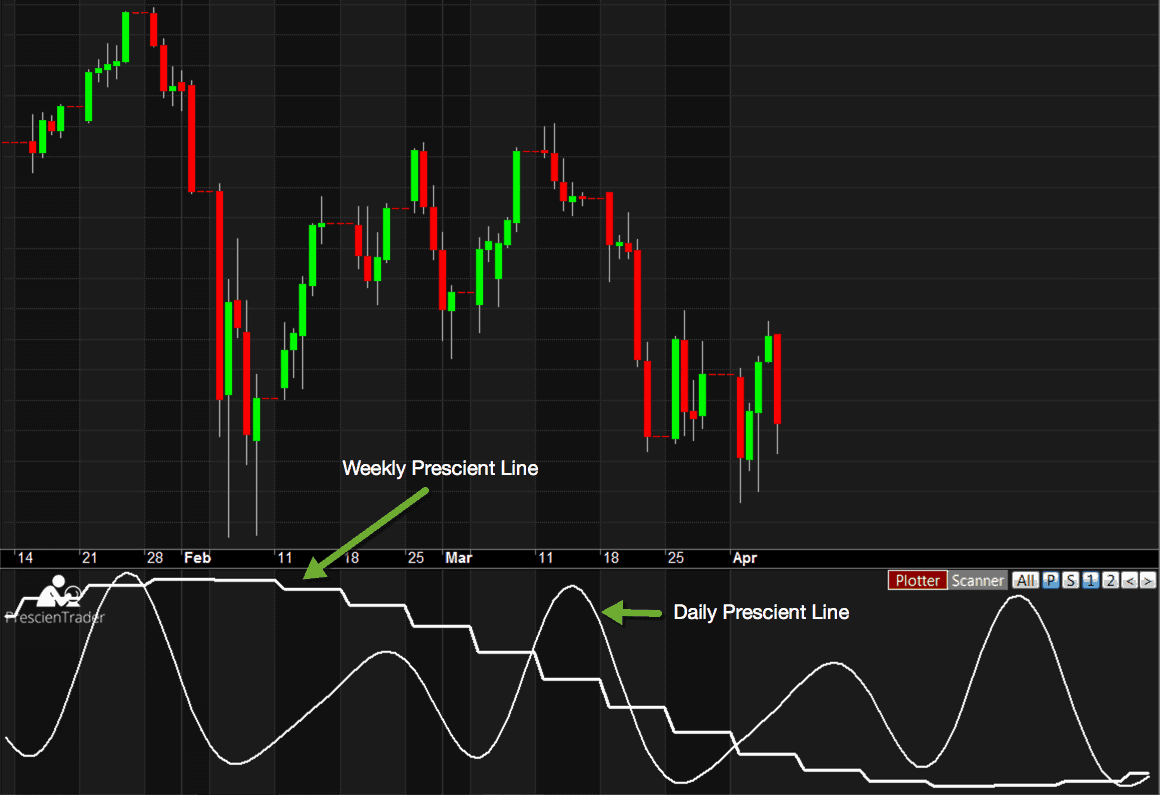
PrescienTrader can analyze any chart on any timeframe. Moreover, it can analyze up to three timeframes simultaneously on the same chart, overlaying the higher time period plots on the base period plot. This can provide valuable context for the base period analysis.
Spectral Analysis
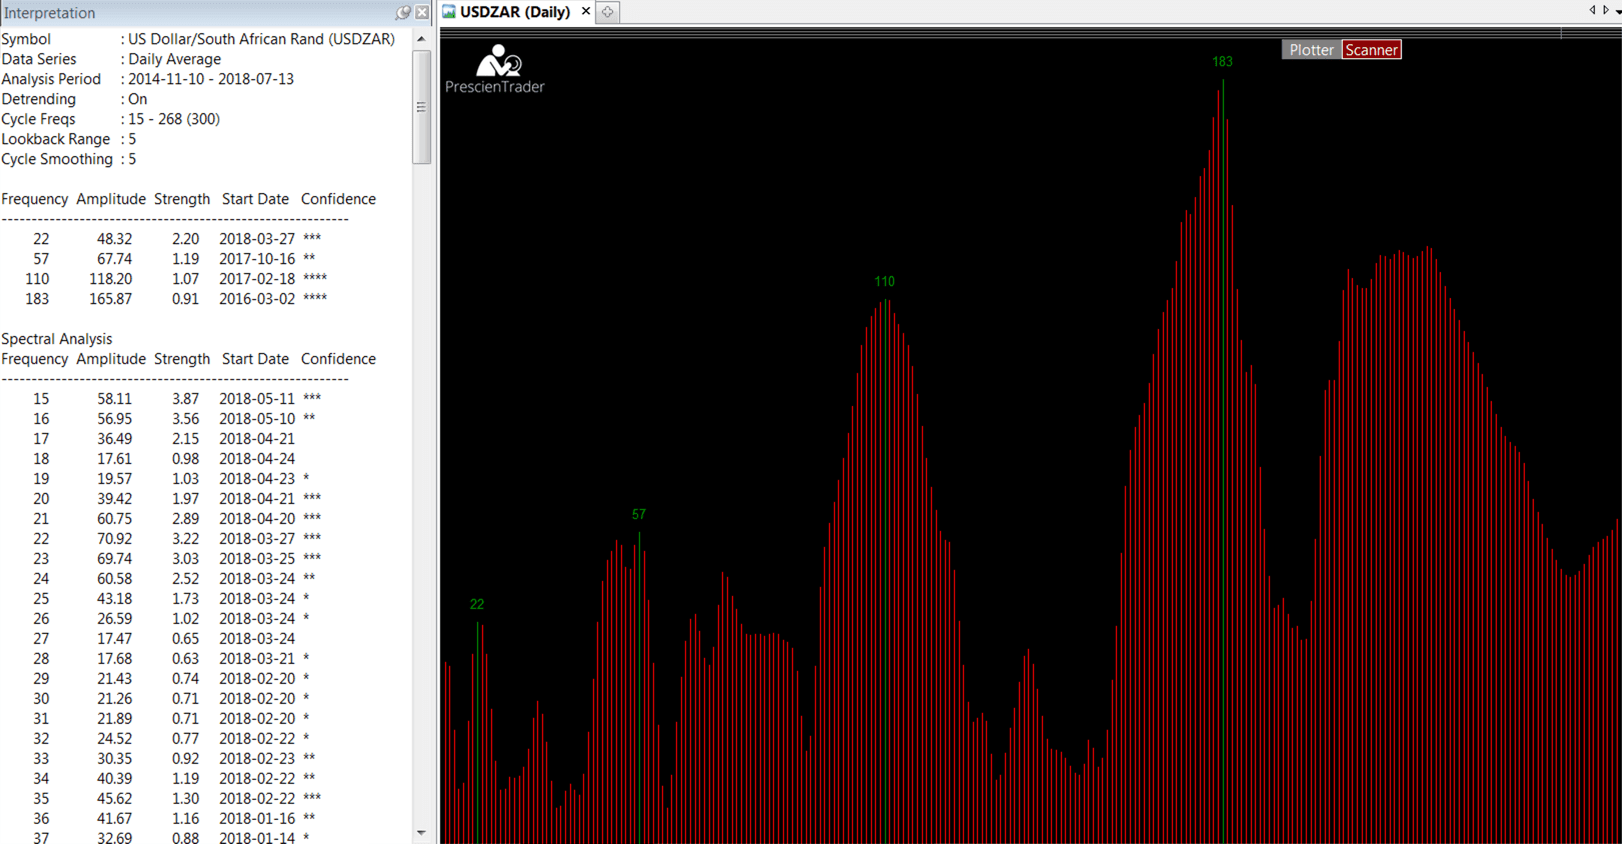
PrescienTrader includes a spectrum analyzer that displays the entire cycles spectrum. This can be useful when fine tuning parameters, as it visualizes the effects of different parameter settings. In addition to the spectral analysis graph, it also provides a detailed report, showing parameter settings, a list of the significant cycles and the data for all analyzed cycles. For each cycle frequency, it displays amplitude, strength, start date/time and confidence, which indicates how closely the cycle frequency correlates with price.
Dynamic FLD / RSI
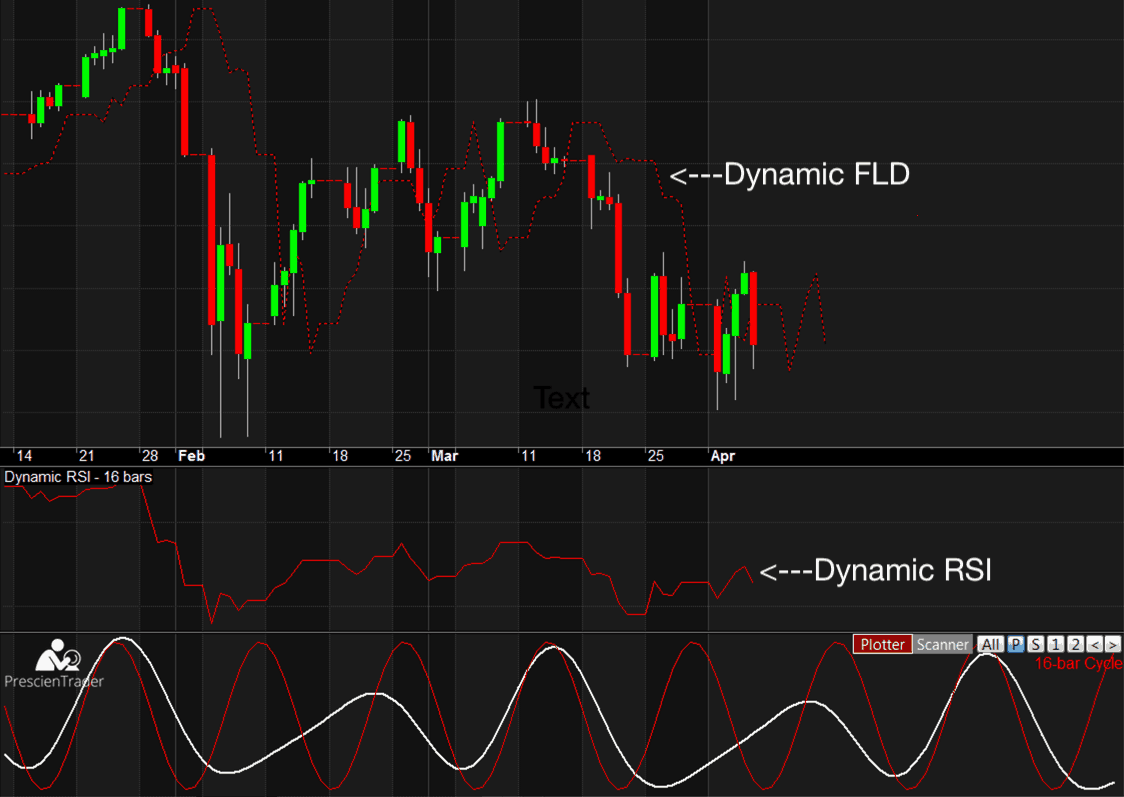
Invented by JM Hurst, the Future Line of Demarcation (FLD) is a plot of the price graph shifted forward in time by half a cycle frequency. When price crosses the FLD, it confirms that a peak or trough has occurred in the corresponding cycle frequency. PrescienTrader can plot the FLDs for any combination of cycle frequencies.
The Relative Strength Index (RSI) indicates the strength of price relative to its recent history over a certain range of bars. When RSI is at a high level and turns down, it indicates the uptrend may be ending and vice versa. The problem with RSI is that using different lookback ranges can yield dramatically different results, so how do you know which lookback range to use? Lars von Thienen invented the concept of the dynamic RSI, which automatically adjusts the lookback range based on cycle frequencies and PrescienTrader provides a dynamic RSI indicator. You can choose between setting the RSI range equal to the cycle frequency or half the cycle frequency.
Backtestng
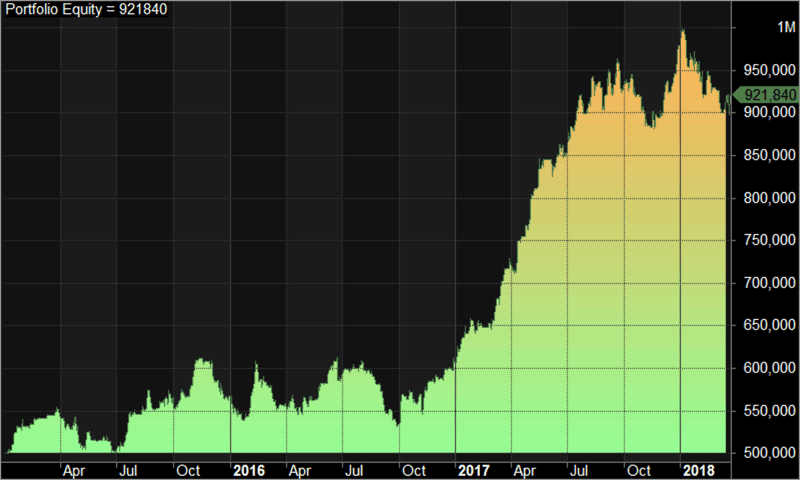
PrescienTrader can access AmiBroker's powerful backtesting engine, which supports true portfolio backtesting, pyramiding, scaling and Monte Carlo simulations. Run backtests against just the cycles data, or test more complex strategies incorporating other formulas and indicators.
Optimization
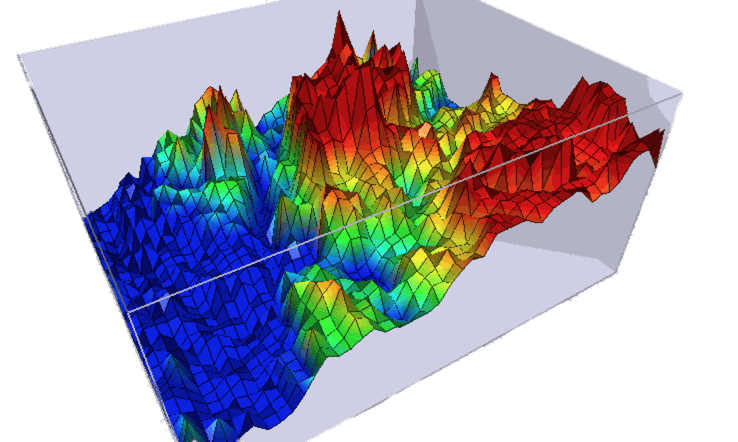
PrescienTrader takes full advantage of AmiBroker's world-class optimization engine, which supports up to 32 threads per analysis window. Optimize up to ten variables simultaneously, with multithreading against a single instrument or across an entire portfolio. Besides exhaustive optimization, AmiBroker also supports smart optimization, including CMA-ES, SPSO and Tribes engines. View the optimization results in table form or as a three-dimensional, fully animated chart, visualizing how the variables interact with one another.
Screening
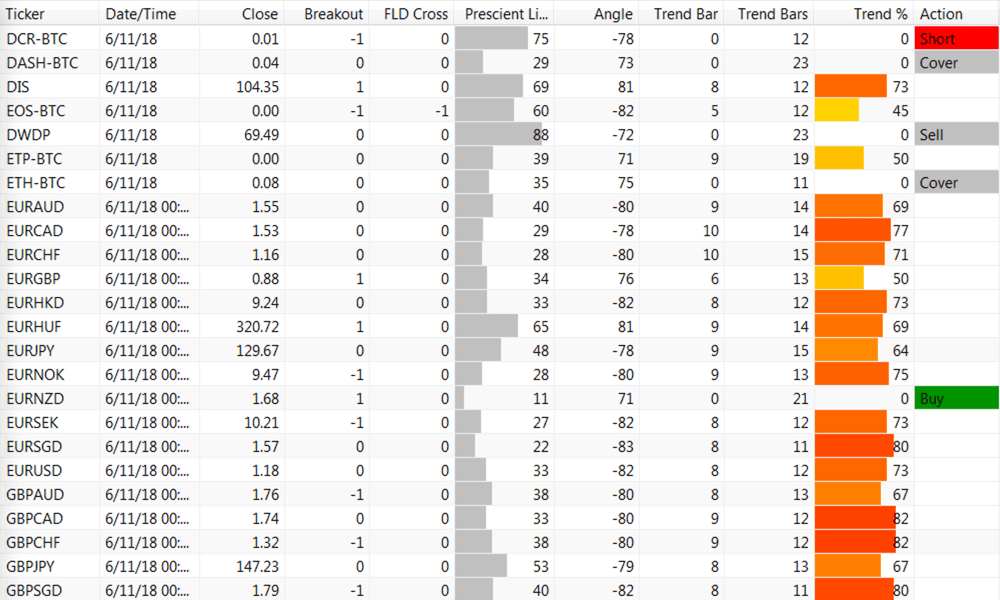
The screening module scans through thousands of financial instruments in your database to filter out trading opportunities based on cycles data. For example, a key cyclical trading signal occurs when price crosses the Future Line of Demarcation (FLD). Therefore, you could search for any chart in which an FLD cross has occurred on the most recent bar, then apply other screening criteria to identify trading opportunities having the greatest probability of success.
Parameter Settings
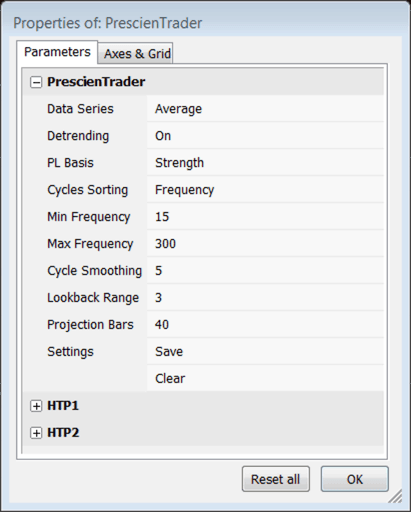
The Parameters dialog allows you to adjust numerous settings, including the data series to analyze, detrending, cycle frequency range, lookback range, projection bars and more. You can control the settings independently for the base timeframe and two higher timeframes (HTP1 and HTP2). When you change settings, the plotter and scanner views update in real time.
PrescienTrader can analyze any data series and optionally perform on-the-fly detrending of the data. You can select a built-in data series, such as OHLC, Avg, etc... or you can use the output from an indicator as a custom data series. Any indicators you add to the chart will automatically show up in the Data Series selection list.
When analyzing lots of different instruments, it's easy to lose track of which settings work best for which instruments. Therefore, PrescienTrader includes the option to save settings individually for each instrument and each timeframe. After saving the settings for an instrument, the saved settings will be recalled automatically, the next time you load that chart.
