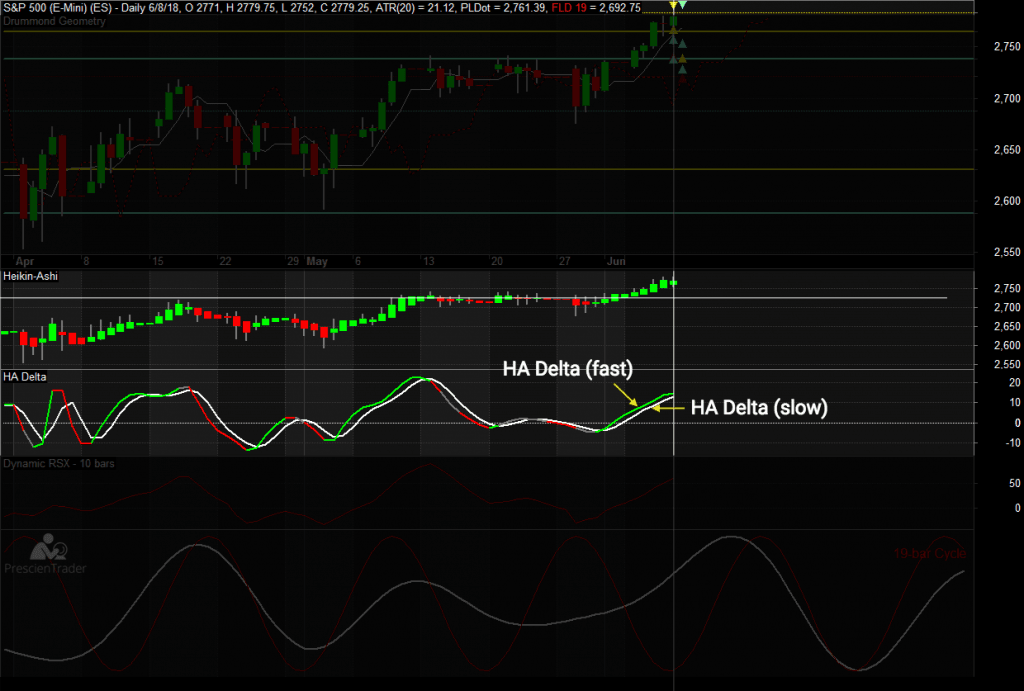
Heikin-Ashi charting is based on Japanese candlesticks, but uses a modified formula that removes some of the noise from the chart, making it easier to identify trends. Many charting packages include Heikin-Ashi candles, but it’s a mistake to use them as price bars, since they don’t represent actual prices. Instead, HA candles should be treated as an indicator. In a long uptrend or downtrend, the HA candles will usually maintain their color (red or green) throughout the trend, while the real price bars may be more choppy. If you notice the HA candles getting smaller and smaller, this indicates a loss of momentum. If a candle then appears in the opposite direction, it’s a warning that the trend may be changing direction.
Heikin-Ashi is a lagging indicator by design. It doesn’t predict what’s going to happen, but it can help to confirm what may have already happened. We use the HA graph in much the same way that we use the FLD and RSX graphs, as confirmation that the Prescient Line prediction is playing out as expected. In addition to the HA candles, we also display a unique indicator called HA Delta.
Developed by Dan Valcu of Educofin, HA Delta is an advanced leading indicator, calculated by subtracting HA Open from HA Close. It often predicts trend changes several bars in advance. We plot HA Delta and a smoothed, slightly lagged version of HA Delta on the same graph. When HA Delta (fast) crosses the smoothed (slow) HA Delta, that indicates a possible upcoming trend change, which is useful for confirming the Prescient Line forecast. For instance, suppose the Prescient Line predicts an upcoming peak:
- As you approach the predicted peak, you’d monitor the HA Delta graph looking for the fast line to cross downward through the slow line.
- Next, you’d look for the price bars to start turning down
- Finally, you’d look for the HA candles to change from green to red. Once you get your first red HA candle, you can be fairly confident that the trend change predicted by the Prescient Line is actually happening.
Besides Heikin-Ashi and HA Delta, we also provide Dynamic RSX and the Future Line of Demarcation as additional confirming indicators. It’s a matter of preference which of these indicators to use in your trading. Ideally, we like to see as many of them lining up as possible, before entering a trade.

