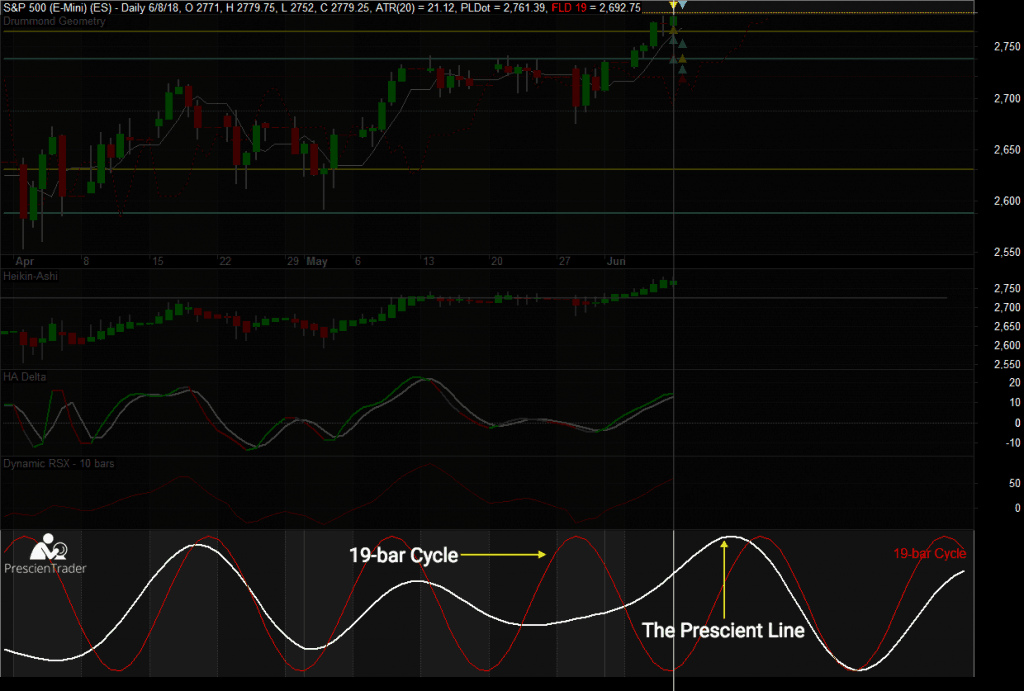
The Prescient Line is the most important indicator on our charts. It’s our signature indicator and is unique to PrescienTrading. The Prescient Line is a price forecast created by analyzing and combining the active cycles, then projecting them forward in time. Unlike most conventional technical analysis indicators, which lag the market, the Prescient Line is a leading indicator that allows you to trade proactively instead of reactively. The Prescient Line projects price forward in time by 30 bars. So, on the daily chart, you’ll have a 30-day forecast, while the weekly and monthly charts will provide 30-week and 30-month forecasts respectively. Nothing works 100% of the time, but the Prescient Line is the most powerful and accurate price prediction model we’ve ever seen.
The Prescient Line graph is displayed as a thick white line in the bottom chart pane. This pane also includes the fastest active individual cycle, displayed as a thin colored line, along with an annotation showing it frequency. For the sake of readability, we only display the fastest cycle, not all the active cycles. Remember, the Prescient Line is formed by combining all the active cycles into a single graph. The Prescient Line is more important than any individual cycle line, but when trading it’s often helpful to see the individual cycle as well.
The Prescient Line’s past history shows how closely it matches up with the past bars. You’ll notice it fits the recent bars very closely, but gradually becomes less accurate, the further back in time you go. This is because our algorithms are biased toward recent cycles. Our research has shown this approach yields the highest predictive value. Also, be aware that the Prescient Line is dynamic, so its historical shape may completely change with each new bar. The goal is not to show what happened in the past, but rather to use the past to predict the future. So if you think the historical Prescient Line graph is impossibly accurate, you’re right. We create an entirely new Prescient Line graph after each new bar, so you can’t use the current bar’s Prescient Line to analyze what happened in the past, only to predict what will happen in the future. It’s important to always consider the Prescient Line in the context of future bars, not past bars. You can evaluate its historical accuracy by viewing historical charts. We provide 90-days worth of chart history, so you can easily go back in time to view the Prescient Line prediction on a given date and compare that with the actual prices on subsequent days. When working with the Prescient Line, always look forward in time, never backwards.

