PrescientSignals
Trading signals service powered by PrescienTrader, the world's most advanced financial market cycles analytic platform.We track and analyze hundreds of financial instruments
And predict price direction with uncanny prescience
Cycles in Financial Markets
The entire universe moves in cycles. From planetary orbits to the tides, to seasons, to the sun rising and setting according to a known cycle, everything in nature is cyclical and financial markets are no exception.
In financial markets, there's a continuous oscillation between fear and greed. As price rises, people become greedy and more and more buyers pour into the market. At a certain predictable point, price reaches an extreme, traders start taking profits and price begins to fall. At this point, fear takes hold and price may fall faster.
While fear and greed may directly drive price, there are many secondary cyclical influences that vary depending on the market. For instance, the price of agricultural commodities is influenced by weather patterns, which are themselves cyclical. The metals are influenced by manufacturing cycles, which are themselves influenced by macroeconomic cycles. Thus in any given market, there will be many cycles at work and each market will have its own unique cyclical signature. To make matters more complex, there are different groups of cycles operating on different timeframes.
The goal of cycle analysis is simply to identify the cycles and project them forward in time. We don’t care what causes them. Our only concern is to determine which cycles are in play along with the frequency, amplitude and phase of each cycle.
PrescienTrader in the Cloud
PrescientSignals is a cloud-based service that delivers actionable and prescient trading signals to your inbox after the close of each trading day.Powered by PrescienTrader
Cycles analysis is nothing new, but our technology represents a quantum leap forward. PrescientSignals is powered by PrescienTrader, the world's most advanced financial market cycles analytic platform. Our proprietary algorithms see through market noise and intelligently adjust to current market conditions, generating an entirely fresh analysis with each new bar. We believe our results speak for themselves. line spaceFlexible Subscription Plans
Our subscription options are extremely flexible. We don't force you to pay for non-actionable data. Subscribe to just the instruments and/or asset classes you want to trade. We currently track hundreds of popular financial instruments, but if you want to add new ones, we'll do our best to accommodate your requests.View Historical Predictions
Trading is as much about psychology as it is about analysis. In your account, you can view detailed charts and signals from all your subscribed instruments for the past 90 days. This allows you to compare our predictions with resulting price movements, increasing your confidence going forward. Having the confidence to enter a trade and stick with it when it goes against you is what separates professional traders from amateurs.Multiple Timeframes
Our signals are optimized for the daily timeframe, so most trades will last anywhere from a few days to a few weeks. However, since cycles operate on all timeframes, we also provide weekly and monthly charts, updated daily. This enables you to view our signals and daily charts in the context of longer-term cycles. Some of our subscribers have longer time horizons and prefer to trade the weekly or monthly charts, using the daily signals as triggers.Multi-Dimensional Analysis
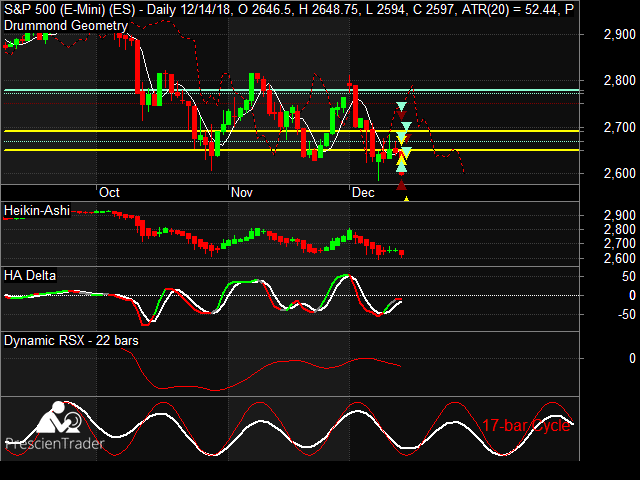
The Prescient Line, which predicts price changes for the next 30 bars, is our signature indicator. However, our charts also feature additional highly sophisticated indicators that provide a more complete understanding of the market structure. These include Drummond Geometry support/resistance lines, the Future Line of Demarcation (FLD), Heikin-Ashi, HA Delta and Dynamic RSX, which is a zero-lag smoothed RSI tuned to the fastest cycle frequency component of the Prescient Line.Expert Commentary
Despite recent advances in AI, we're still years away from computers being able to replicate the brain's ability to process data in parallel, recognize patterns and make decisions based on the fuzzy logic of intuition. So while we constantly seek to improve our algorithms, we occasionally write expert commentary when we notice a particularly interesting trading setup or if we disagree with a signal. Thus, our subscribers get the best of both worlds: computer-generated signals supplemented by human expert commentary.The Prescient Line
Our signature indicator, the Prescient Line, analyzes and intelligently filters market cycles to predict price changes over the next 30 barsLive Prescient Line
- The graph at the bottom of this chart is the Prescient Line, our proprietary price prediction line. Since this is a demo, the chart is delayed by one week, but it projects 30-days into the future, so you can compare its forecast from a week ago with the actual S&P price over the past week.
- The Prescient Line is dynamic, meaning it performs a new analysis from scratch after each new bar, potentially changing its shape on past bars. However, for the purpose of live trading, the past is irrelevant; we only care about the future.
- Nothing works 100% of the time, but the Prescient Line is the most powerful and accurate price forecasting tool we've ever seen. To varying degrees, It works on all financial instruments in all timeframes.
Static Prescient Line
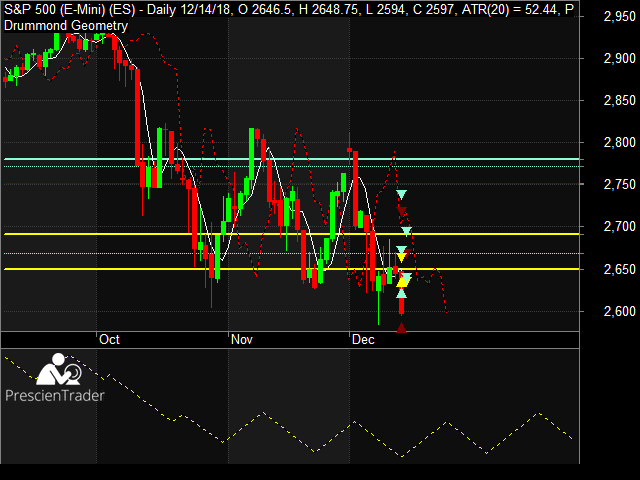
- We use the STATIC Prescient Line to view past predictions and perform backtesting. This is necessary because the Live Prescient Line has no memory of its past predictions; it only looks to the future.
- To create the Static Prescient Line, we take snapshots of the angles of all past Prescient Lines and combine them into a single graph. Mathematically speaking, this is a first order derivative of the past Prescient Lines. It allows us to look back in time and view the Prescient Line direction from any prior date. Since the Static Prescient Line is a derivative, it looks very different from the Live Prescient Line, but it conveys the same information.
- In this chart, we've replaced the Live Prescient Line graph with the Static Prescient Line. You can view any past date on the chart and compare the Static Prescient Line direction with the actual price direction on subsequent days. Generating a Static Prescient Line chart requires tremendous CPU resources, so it's not practical to generate it every day for all instruments. However, you can obtain the same information by viewing the live charts in your account from the past 90-days.
How this Works
Select your Instruments / Asset Classes
Select the financial instruments and/or asset classes you want to track. You can purchase a subscription for individual financial instruments, asset classes, or any combination. We offer asset class subscriptions for equities, futures, Forex and cryptocurrencies. Subscribing to an asset class unlocks our analysis and signals for all instruments in that class. For example, if you subscribe to the Forex class, you'll gain access to analysis and signals for all Forex pairs.
Receive updated charts and trading signals after each trading day
After the close of each trading day, you'll receive updated daily, weekly and monthly charts for your subscribed instruments. You can view the charts on our website, for the current day and all prior days. The charts feature our signature indicator, the Prescient Line, plus various supporting indicators, including Drummond Geometry lines, Heikin-Ashi, HA Delta, Dynamic FLD and Dynamic RSX. You'll also receive email alerts when we issue trading signals for any of your subscribed instruments.
Execute Trades
Each trading signal specifies Buy, Sell, Short or Cover. The easiest approach is to follow our signals exactly. This is what most of our subscribers do. However, you can also use our signals to supplement your own analysis. For example, if you're a day trader, you can boost your Alpha by entering day trades in the direction of our predicted price, rather than fighting the trend.


