PrescienTrader allows you to analyze ANY data series, not just the built-in data series, Open, High, Low, Close, Volume, Open Interest. While most users will never use this capability, it provides unlimited flexibility for advanced users who may want to analyze cycles in esoteric data series.
To analyze a custom data series, follow these steps:
- Create an indicator based on your custom data series.
- Drag the indicator into the PrescienTrader chart pane.
- Edit the generated formula and move the indicator code so it’s above the PrescienTrader code.
- Select the custom indicator in the PrescienTrader Data Series parameter.
Example: Analyze a Triple Exponential Moving Average (TEMA) of the Close.
Analyzing the cycles in a moving average of a built-in data series is not particularly useful, since the same cycles already exist in the underlying data series. Nevertheless, this is just an example to demonstrate how to analyze a custom data series. You can follow the same procedure to analyze the data series of any custom indicator.
- In AmiBroker, locate TEMA in the Averages folder and drag the formula into the PrescienTrader chart pane. Notice, the TEMA is displayed as a nearly horizontal orange line. The reason it’s horizontal is because the chart pane is scaled for the PrescientLine, which in this case, is a much larger range than the price range of the charted instrument. This is not important; we don’t care about the TEMA graph. Our goal is simply to make the TEMA data series available to PrescienTrader.

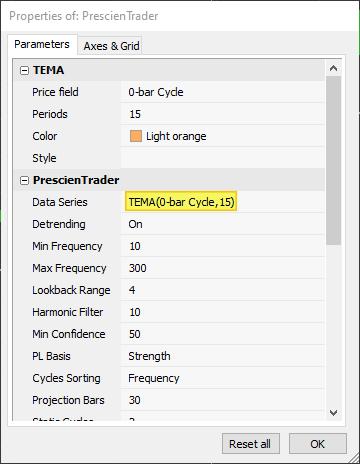
- Right-click on the chart pane and select Parameters to open the Parameters window. Notice, TEMA does NOT appear as an option in the PrescienTrader Data Series parameter. This is because the TEMA indicator was inserted AFTER the PrescienTrader indicator. To fix this, we must edit the formula for the chart pane by right-clicking on the chart pane and selecting the Edit Formula option. Then move the TEMA indicator code so it appears BEFORE the PrescienTrader code.
Before:
After:
- Now, open the Parameters window again and you’ll see TEMA appears as one of the options for the Data Series parameter. Select the TEMA option and click OK.

Notice, the PrescienTrader graph is essentially unchanged. Since TEMA is a moving average of the price average, the cycles are the same. However, because TEMA appears first in the formula, the graph is now scaled correctly for TEMA.
